Performance and errors monitoring
You can monitor DB performance and errors using distributed tracing. Tracing allows you to see how a request progresses through different services and systems, timings of every operation, any logs and errors as they occur.
go-pg supports tracing using OpenTelemetry API. OpenTelemetry is a vendor-neutral API for distributed traces and metrics. It specifies how to collect and send telemetry data to backend platforms. It means that you can instrument your application once and then add or change vendors (backends) as required.
go-pg comes with an OpenTelemetry instrumentation called pgotel that is distributed as a separate module:
go get github.com/go-pg/pg/extra/pgotel/v10
To instrument go-pg database, you need to add a hook provided by pgotel:
import (
    "github.com/go-pg/pg/v10"
    "github.com/go-pg/pg/extra/pgotel/v10"
)

db := pg.Connect(&pg.Options{...})

db.AddQueryHook(pgotel.NewTracingHook())
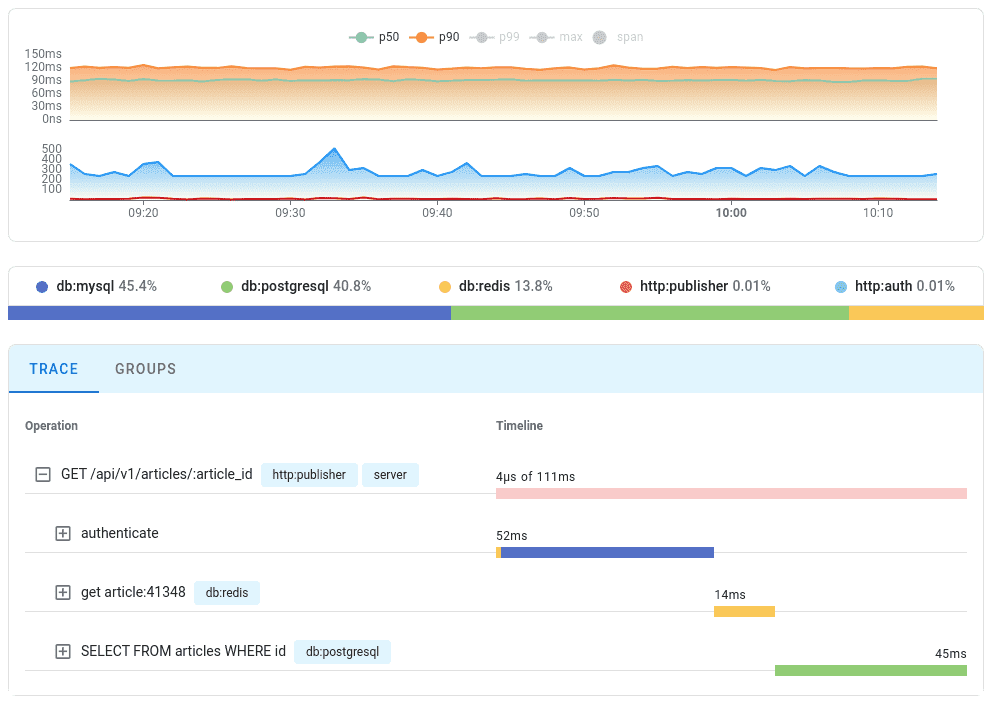
As expected, go-pg creates spans for processed queries and records any errors as they occur. Here is how the collected information is displayed at Uptrace: